CS 106 Winter 2017
Assignment 03: Advanced Shapes
Question 1 Campus Map
Postscript, like PDF and SVG, is a file format for describing vector illustrations. In fact, Postscript is much more: it's a full programming language, masquerading as a way to describe a picture. In this question you will write a sketch that reads a postscript file and extracts the drawing commands in order to produce a drawing of buildings on the UW campus (at least, the part bordered by University, Westmount, Columbia, and Phillip).
Create an empty sketch called Campus. Download the file buildings_simp.ps and add it to the sketch. The file was created from the main campus map by removing all non-building paths in Adobe Illustrator, cleaning up the remaining paths, and saving it as Postscript. (If you Illustrator or Inkscape, you can open this file and examine the shapes.)
Open the file buildings_simp.ps in a text editor, just to get a sense of what's in it. You'll see a large amount of undecipherable code, sure. Fortunately, there are only three kinds of lines that we actually care about. Scroll down to find examples of these:
Lines of the form "x y moveto" are a command to start a new path at position (x,y). That's basically a combination of beginShape() and vertex().
Lines of the form "x y lineto" are a command to continue the current path by extending it to (x,y). That's equivalent to vertex().
Lines that say "closepath" finish the current path (as in endShape()).
There are many other kinds of lines of text in this file, but we can safely ignore them all, except for the ones above. What's important here to build your intuition for the connection between Postscript's moveto, lineto, and closepath and Processing's beginShape(), vertex(), and endShape().
Give your sketch a setup() function that sets the sketch window to size 800×600 with a white background. As with other recent exercises, you only need a setup() function in this sketch. Choose fill and stroke colours that you plan to use to draw the campus buildings.
In setup(), use a for loop to iterate over every line of text in the file. When you encounter a line ending in moveto, lineto, or closepath, call the appropriate set of Processing functions. (You'll probably want to use splitTokens() to check the last word on each line. But be careful—some lines of text are empty, so you can't always assume that a line has a last word.) Make sure that you close all of your paths!
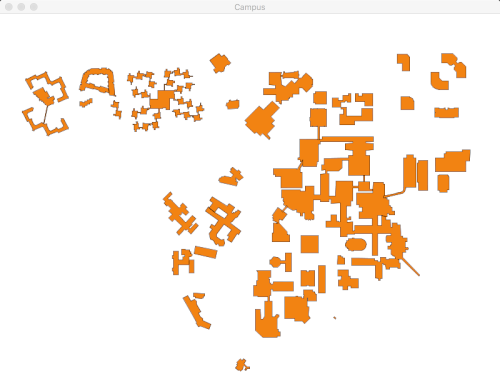
If you perform the steps above, you'll probably end up with a picture like this:
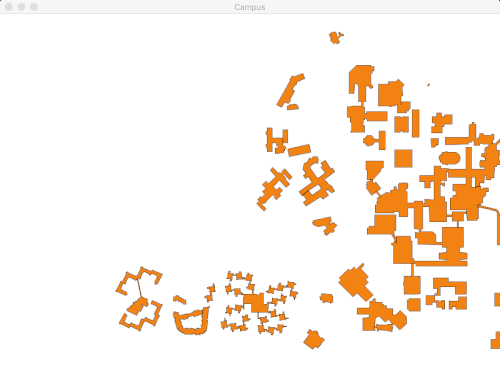
The campus buildings are shifted to the right, and the whole picture is upside-down. You'll need to adjust your code to fix these two problems. The fix isn't that difficult: every time you call vertex(), subtract 150 from the x coordinate and flip the y (by subtracting it from height).
The whole sketch can be written in fewer than 30 lines of code, not counting comments.
Place your Campus sketch inside a folder
called A03.
Question 2 Dow Jones
The Dow Jones Industrial Average (DJIA), the most venerable figure in US markets, recently went over 20,000 for the first time. To celebrate this historic occasion, we'll create a plot of the Average for every business day since Halloween, together with the day's low and high values.
Create a new sketch called DowJones, with size 800×600. Download the file dowjones.txt and add it to the sketch.
The file contains daily information about the DJIA, with each day's information on one line in the following form:
2016-11-22 18962.820312 19043.900391 19023.869141
The "words" on this line are the date, followed by the low, the high, and the closing values for the DJIA that day.
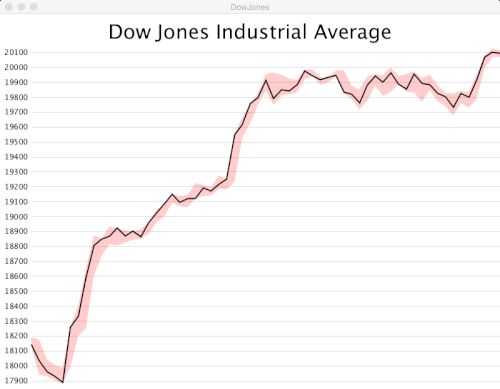
Add code that draws a plot of the close value of the daily DJIA, corresponding to the black graph in the screenshot above. Some notes:
Use beginShape(), vertex(), and endShape() to draw the graph.
It's fine if the points in this plot are evenly spaced horizontally, even though the dates are not all consecutive in the data file.
The plot should be scaled so that it fits entirely within the horizontal and vertical extents of the sketch window. The built-in map() function is your friend. In the example above, the bottom of the plot is at 17,850 and the top is at 20,150.
Make sure you don't draw the plot upside-down—that's an easy mistake to make.
Now add code to draw the "stripe" shown above, displaying the daily range from low to high. Put this code before the code that draws the plot of the daily close, so that it's drawn underneath.
The simplest approach is to loop over the array twice, with both loops contained inside a single beginShape()/endShape() pair. In the first loop, place all the vertices of the daily low values using vertex(), as you did with the plot of the close values. Then walk backwards over the array, placing vertices for the high values. close up the shape, and you should get a stripe. Note that the stripe completely contains the plot of daily close values.
Once again, you can potentially put all your code into setup()—there's nothing that needs to be drawn once per frame, and no interaction. On the other hand, you may choose to introduce one or more helper functions to make the code more elegant.
These are the only requirements for this question. We invite you to experiment with enhancements. The screenshot above includes the obvious enhancements of drawing and labelling lines for different DJIA values, and adds a title to the graph, neither of which you need to do. You could place vertical lines at important dates (holidays, the US election, inauguration, etc.). You could also experiment with interactivity, for example by displaying the date and values as the mouse moves left and right over the graph. We will award bonus marks for creative or ambitious enhancements.
Place your finished DowJones sketch in your A03 folder.
Submission
When you are ready to submit, please follow these steps.
If necessary, review the Code Style Guide and use Processing's built-in auto format tool. You do not need to use the precise coding style outlined in the guide, but whatever style you use, your code must be clear, concise, consistent, and commented.
If necessary, review the How To Submit document for a reminder on how to submit to LEARN.
Make sure to include a comment at the top of all source files containing your name and student ID number.
Please ensure that any sketches you submit compile and run. It's better to submit a sketch that runs smoothly but implements fewer required features than one that has broken code for all features. If you get partway into a feature but can't make it work, comment it out so that the sketch works correctly without it.
Zip up the A03 folder, containing the Campus and DowJones sketches, to create an archive called A03.zip. Do not deviate from any of these required file and folder names.
Upload A03.zip to LEARN. Remember that you can (and should!) submit as many times as you like. That way, if there's a catastrophe, you and the course staff will still have access to a recent version of your code.