Tools
We will be using a variety of tools to facilitate communications among teams and course personnel, modelling, and documentation. It is good to set these up in the first week of classes.
See also Syllabus → Platforms
Diagramming
Your deliverables will include a number of UML diagrams. We don’t really care what tools you use for this, as long as the end result looks reasonably professional (clear and readable). However, we can recommend that you use a modelling tool1 rather than a drawing tool (to ease the creation of models) and we strongly recommend using a tool that enables real-time collaborative modelling so that your team can all contribute to the creation of models during team meetings.
Lucidchart
We currently recommend Lucidchart, which supports the creation of a wide variety of models, including the more sophisticated models that you will build towards the end of the course, and supports real-time collaborative modelling. There is a free version but the normal free version is not likely to be sufficient for creating the size of models needed for this course. Instead, you want the free Educational Plan, which is sufficient for the models you will create for this course. To obtain an upgrade, perform the following actions:
- Obtain a free Lucidchart account.
- be sure to use your UW email address as your account name
- when prompted (possibly more than once), indicate that you are a student in higher education
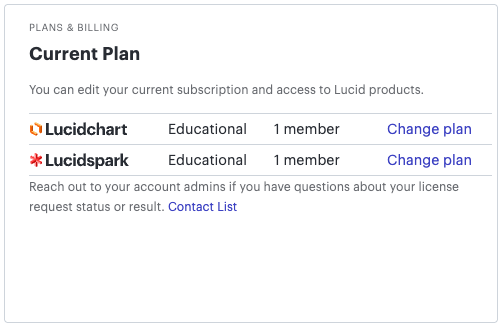
- You should be promoted to an educational plan automatically. Check by going to your
account and looking for “Educational”:
- If you have not been enrolled in an educational plan, request an upgrade. In your request, indicate that you are enrolled in a university-level software modelling course that will ask you to create models with more than 100 model elements in them.
- Within a day or two, you should receive an email indicating whether your request has been accepted.
Then you’re in! You can create diagrams, share them with your teammates, and synchronously edit your diagrams in real-time.
The Education Plan allows you to create three diagrams, with an unlimited number of objects per diagram. So between you and your teammates you can create 12-15 diagrams. A possible work-around for this limit is to put multiple diagrams in a single document. Create a presentation (slide deck) with one diagram in each slide. Then export that slide deck to PowerPoint.
Visio
A possible alternative is Visio, part of your Microsoft 365 suite of tools through the University.
Diagrams.net
An alternative online tool that a number of students have used successfully in the past is app.diagrams.net.
Edit Large Structured Documents Collaboratively
You will want to use writing tools that allow for on-line collaboration. Several alternatives are:
- MS365 Word Online: An on-line implementation of MS Word, via your student account.
- Google Docs: An on-line editor you’re probably all familiar with.
- Overleaf: A collaboration tool based on LaTeX.
- Typst: A LaTeX/Overleaf alternative, using a different syntax.
Markup languages like LaTeX and Typst shine for large, structured documents like your SRS. It is generally easier to be consistent across the entire document and use cross-references and other tools than with a WYSIWYG editor. Macros are available to do some pretty fancy stuff. The downsides are a steeper learning curve and needing to debug your markup code.
WYSIWYG editors like Word or Google Docs have a much shallower learning curve but it’s harder to achieve consistancy across a large document. Styles help a lot. Spend time up front defining styles (with a dictionary to say what each style is for) and then using them throughout.
-
Meaning that, at a minimum, it can connect objects with lines and maintain those connections as you move the objects around. ↩︎