Documentation
Technical documentation is an important part of your project! Although you aren’t expected to write exhaustive documentation most of the time, we often need to record important ideas, or communicate with other team members. Usable documentation really helps.
Examples of useful documents that you will likely encounter in a software project include:
- Project documents, detailing project constraints, timelines, and so on.
- Requirements documents, detailing the requirements that you are expected to deliver.
- Design documents that explain how some critical system works. You should be writing these when planning out features: both as a way to share your design with your team-mates, and as a way to record the details for reference later (remember: we’re always plan to maintain systems long-term).
- User documents, explaining how to use your software.
- Product release documents, including Release Notes, README files.
We’ll discuss using Markdown for technical documents, and Mermaid.js for embedding diagrams.
These are popular formats that are easy to use, and are well-supported by GitLab: you can embed markdown and mermaid diagrams in your GitLab README.md file, or directly in your project Wiki!
Markdown
Markdown is a markup language that allows you to add formatting elements to a text file. The elements that you can add are reminiscent to HTML elements, which makes sense - Markdown was designed to be easily convertable to HTML (which is itself also a markup language). The basic syntax is here.
All the content on this website is generated from Markdown using the Retype framework. Markdown has become the de-facto standard for informal technical documentation.
Syntax
Markdown supports the following tags:
| Symbol | Meaning |
|---|---|
| # | Heading 1 |
| ## | Heading 2 |
| ### | Heading 3 |
| * | Bullet |
| - | Also bullet |
| 1. | Item in a numbered list |
| (title)[URL] | Link to an online document |
| !(title)[URL] | Embed an online image |
| empty line | Denotes a paragraph break |
| *text* | Surrounding text for emphasis |
| _text_ | Also means emphasis |
| **bold** | Surrounds text to embolden |
When Markdown is used in GitLab, either in a file or a Wiki page, the renderer is able to display formatted text! This makes it beneficial when writing technical documentation.
Example
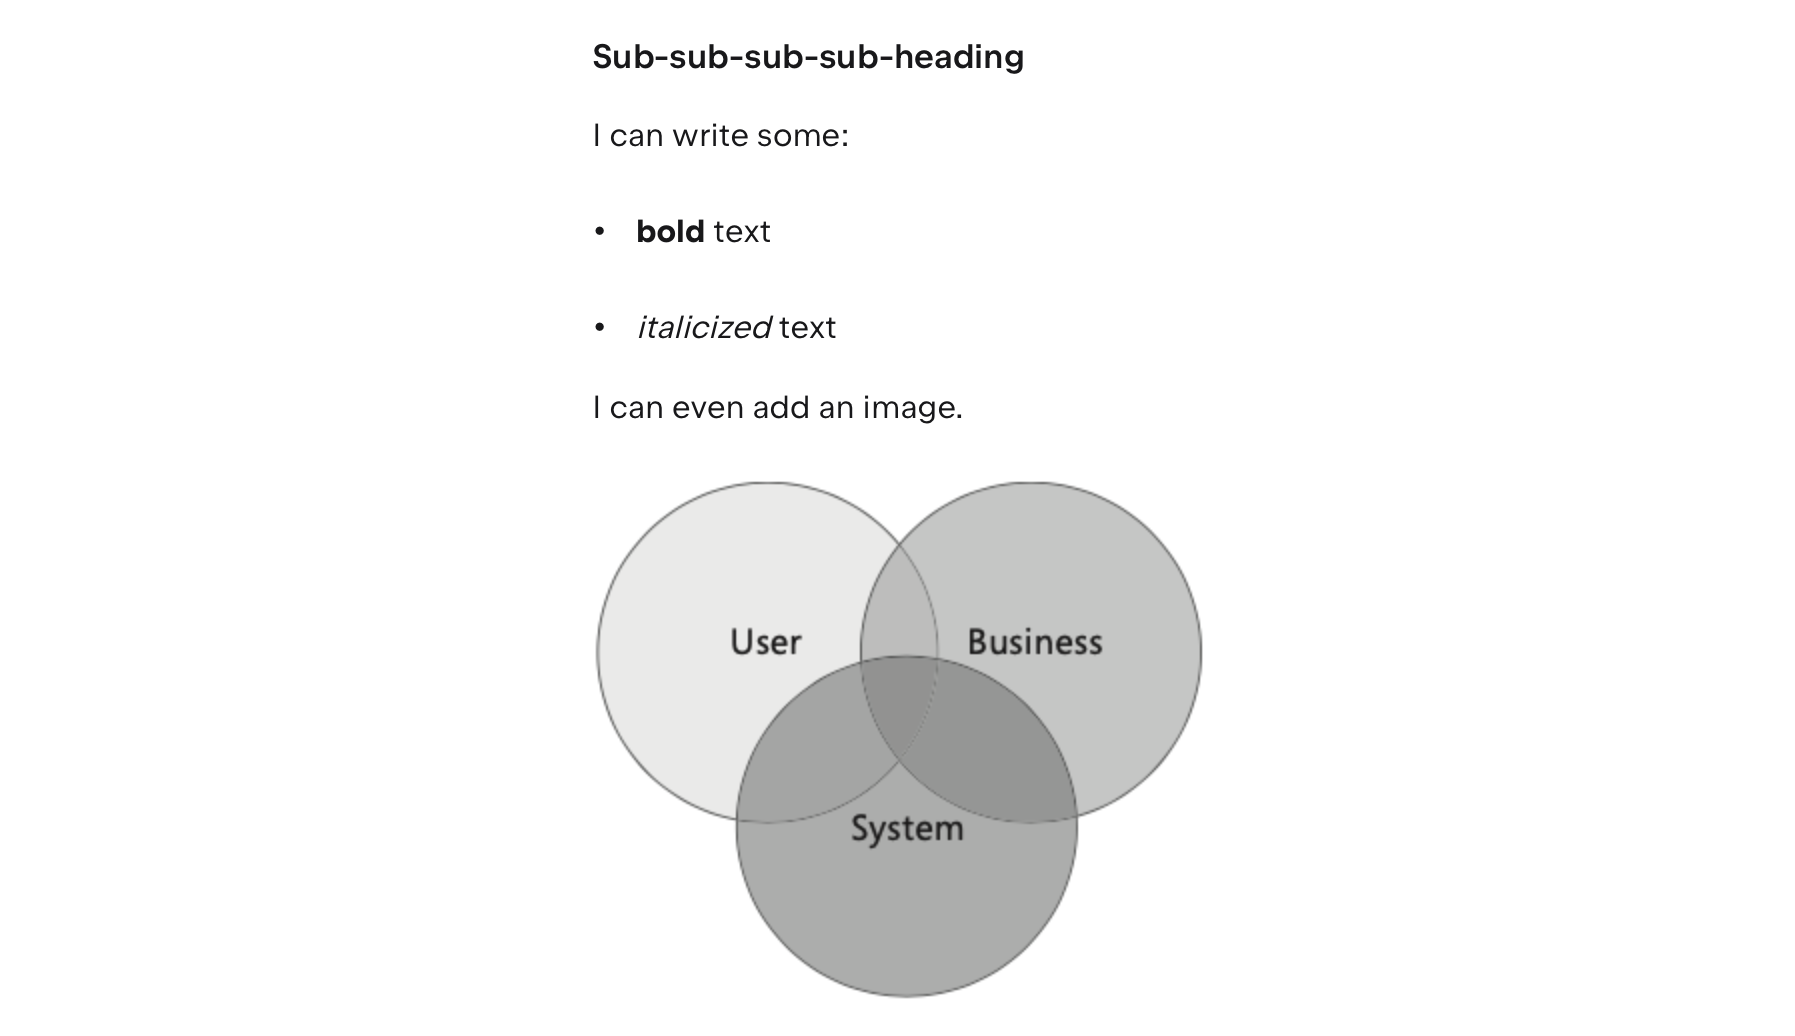
For example, in my editor I can add a paragraph with a bunch of styling:
#### Sub-sub-sub-sub-heading
I can write some:
* **bold** text
* _italicized_ text
I can even add an image.

This gets displayed in my editor’s preview window like this:
Authoring a Markdown document can be done in any text editor, but you might appreciate an editor that has syntax highlighting and a live preview. These all work well:
By convention, Markdown files should end in .md. For example, README.md in your project root should be a Markdown formatted text file.
Diagrams (Mermaid.js)
We often add diagrams to documents to clarify and communicate additional information. These can include Gantt charts or burn-down charts for project tracking; illustrative graphs when determining requirements, and a variety of diagrams during the design and implementation phases.
Mermaid is a Javascript-based charting tool that can convert Markdown diagramming notation into diagrams.
The advantage to using Mermaid.js is that your diagrams are completely described in Markdown. GitLab also renders Mermaid.js diagrams easily, so you can use them directly in your project README file, or any of your Wiki pages to render inline diagrams.
The editors described above all support Mermaid.js rendering. You might also want to try the Mermaid live editor. It generates raw mermaid syntax, which you can then add to an existing Markdown document.
The GitLab built-in Web IDE doesn’t seem to recognize Mermaid diagrams. However, if you edit the file in a supporting editor, it will display the diagram properly, and it will be rendered properly when the Markdown is viewed in GitLab.
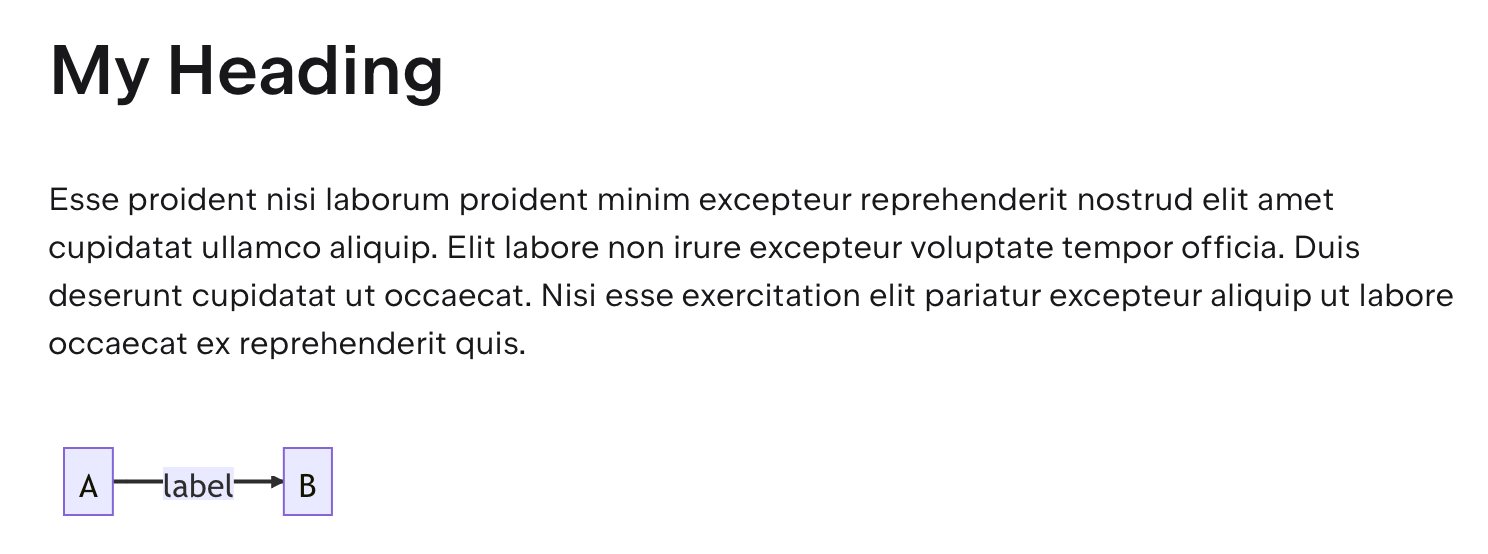
To render diagrams in Markdown, they need to be embedded as a code block element. Markdown uses three backticks to start and end a code-block. After the first three backticks, you enter the language name, in this case mermaid, followed by the diagram syntax, and then three final backticks to close it.
The diagram syntax is a diagram type, followed by a flow indicator. e.g. flowchart LR for a flowchart flowing left-to-right (indicators include LR, RL, TB, BT). For example, here’s a simple flowchart, placed in the middle of some text in a Markdown document.
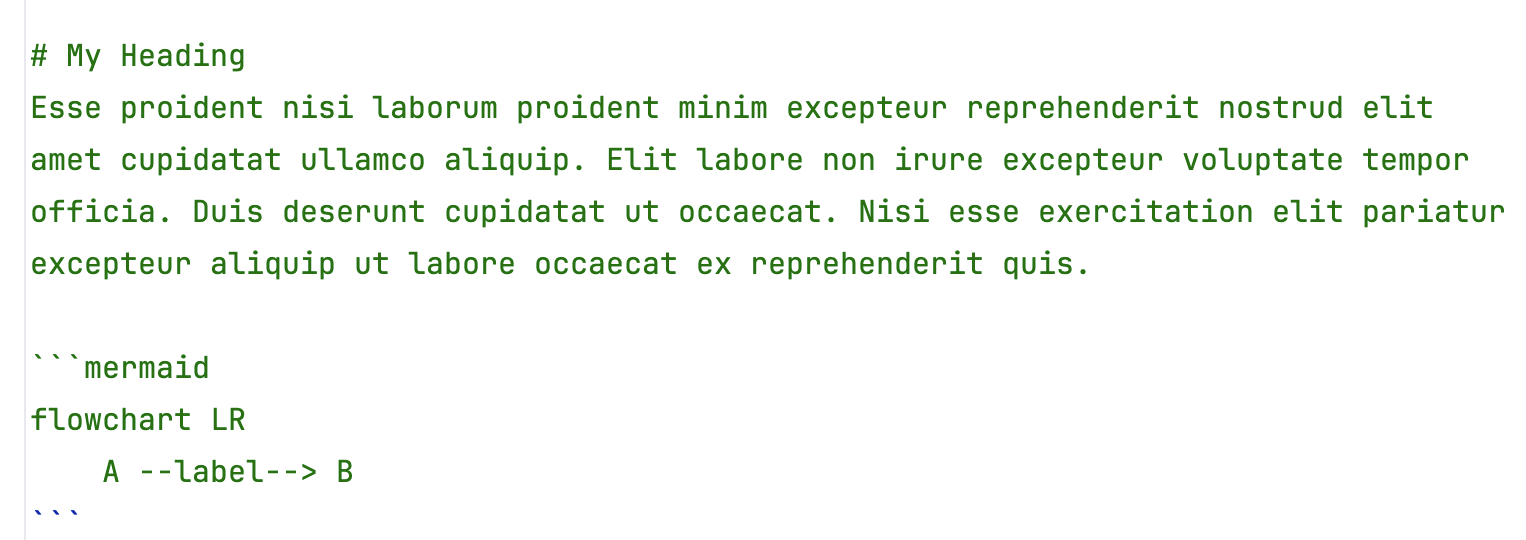
This would produce output like this:
This is a short list of diagrams taken directly from the Mermaid Documentation. See that page for a more complete reference.
Flowchart
Here’s a flowchart diagram showing program execution.
flowchart LR
    A[Start] --> B{Is it?}
    B -->|Yes| C[OK]
    C --> D[Rethink]
    D --> B
    B ---->|No| E[End]
flowchart LR
    A[Start] --> B{Is it?}
    B -->|Yes| C[OK]
    C --> D[Rethink]
    D --> B
    B ---->|No| E[End]
flowchart TD
    Auth{"User Authenticated?"} -- No --> LoginScreen["Show Login Screen"]
    LoginScreen -.-> Auth
    Auth -- Yes --> MainMenu["Add"]
    MainMenu --> Logout["Details"]
    Logout --> Exit(["End"])
    Start(["Start"]) --> Auth
     Auth:::Sky
     Exit:::Rose
     Start:::Rose
     Start:::Aqua
    classDef Sky stroke-width:1px, stroke-dasharray:none, stroke:#374D7C, fill:#E2EBFF, color:#374D7C
    classDef Aqua stroke-width:1px, stroke-dasharray:none, stroke:#46EDC8, fill:#DEFFF8, color:#378E7A
    classDef Rose stroke-width:1px, stroke-dasharray:none, stroke:#FF5978, fill:#FFDFE5, color:#8E2236
User Journey Diagram
User Journey Diagrams are a useful way to show a series of steps that a user might take to perform an operation in your software. These could be used to model User Stories.
journey
    title My working day
    section Go to work
      Make tea: 5: Me
      Go upstairs: 3: Me
      Do work: 1: Me, Cat
    section Go home
      Go downstairs: 5: Me
      Sit down: 5: Me
journey
    title My working day
    section Go to work
      Make tea: 5: Me
      Go upstairs: 3: Me
      Do work: 1: Me, Cat
    section Go home
      Go downstairs: 5: Me
      Sit down: 5: Me
Gantt Chart
Here’s the Gantt chart syntax. Gantt charts are the most common project management charts, great for showing milestones and critical project dependencies.
gantt
    title A Gantt Diagram
    dateFormat  YYYY-MM-DD
    section Section
    A task           :a1, 2014-01-01, 30d
    Another task     :after a1  , 20d
    section Another
    Task in sec      :2014-01-12  , 12d
    another task      : 24d
gantt
    title A Gantt Diagram
    dateFormat  YYYY-MM-DD
    section Section
    A task           :a1, 2014-01-01, 30d
    Another task     :after a1  , 20d
    section Another
    Task in sec      :2014-01-12  , 12d
    another task      : 24d
Timeline diagram
Here’s a timeline diagram, which is also useful for project tracking.
timeline
    title History of Social Media Platform
    2002 : LinkedIn
    2004 : Facebook
         : Google
    2005 : Youtube
    2006 : Twitter
timeline
    title History of Social Media Platform
    2002 : LinkedIn
    2004 : Facebook
         : Google
    2005 : Youtube
    2006 : Twitter
Mindmap
Here’s a mindmap of the course!
mindmap
  root((Topics))
    (Design)
        Requirements
        Design thinking
        Personas
        User stories
        Prototyping
    (Practices)
        Agile
        Branching
        Build configuration
        Pair programming
        Unit testing
        Documentation
    (Technologies)
        Gradle
        JUnit
        Docker
        Markdown
        Mermaid
    (Development)
        Kotlin programming
        OO programming
        Functional programming
        Databases
        Concurrency
        Web services
        Cloud hosting
Technical Diagrams (UML)
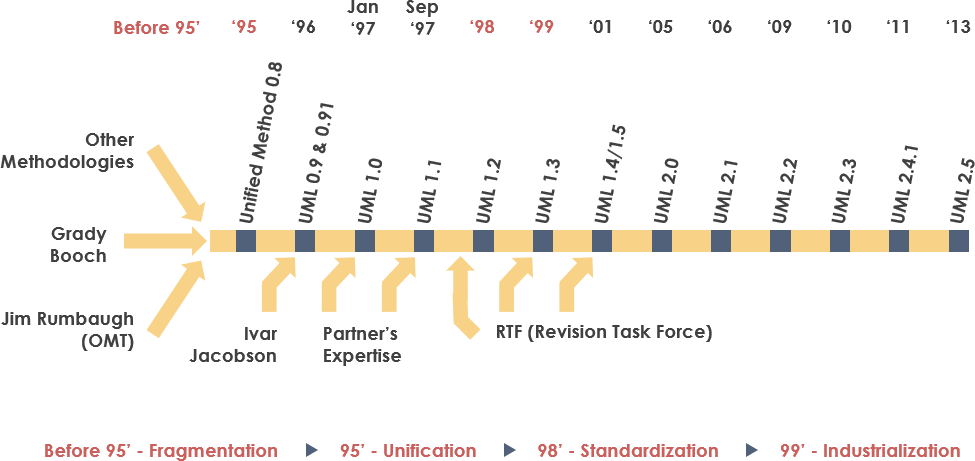
The Unified Modelling Language (aka UML) is a modelling language consisting of an integrated set of diagrams, useful for designers and developers to specify, visualize, construct and communicate a design. UML is a notation that resulted from the unification of three competing modelling techniques:
- Object Modeling Technique OMT (James Rumbaugh 1991) - was best for analysis and data-intensive information systems.
- Booch (Grady Booch 1994) - was excellent for design and implementation. Grady Booch had worked extensively with the Ada language, and had been a major player in the development of Object-Oriented techniques for the language. Although the Booch method was strong, the notation was less popular.
- OOSE Object-Oriented Software Engineering (Ivar Jacobson 1992) - featured a model known as Use Cases.
Diagrams in this section are taken from the Visual Paradigm Guide to UML
All three designers joined Rational Software in the mid 90s, with the goal of standardizing this new method. Along with many industry partners, they drafted an initial proposal which was submitted to the Object Management Group in 1997. This led to a series of UML standards driven through this standards body, with UML 2.5 being the current version.
The primary goals of UML include:
- providing users with a common, expressive language that they can use to share models.
- provide mechanism to extend the language if needed.
- remain independent of any particular programming language or development process
- support higher-level organizational concepts like frameworks, patterns.
UML contains a large number of diagrams, intended to address the needs to a wide range of stakeholders. e.g. analysis, designers, coders, testers, customers.
UML contains both structure and behaviour diagrams.
- Structure diagrams show the structure of the system and its parts at different level of abstraction, and shows how they are related to one another.
- Behaviour diagrams show the changes in the system over time.
Below, we’ll highlight the most commonly used UML diagrams. For more comprehensive coverage, see Visual Paradigm or Martin Fowler’s UML Distilled (Fowler 2004).
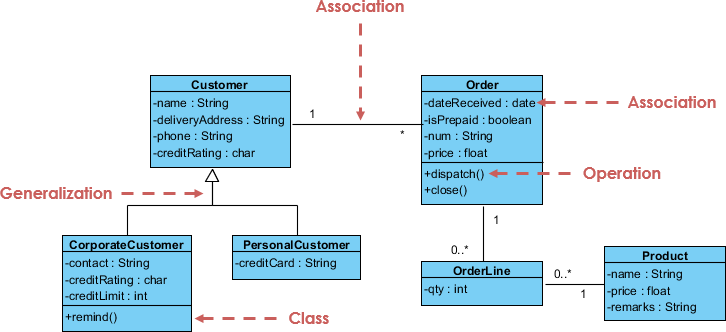
Class Diagram
The class diagram is a central modeling technique that runs through nearly all object-oriented methods. This diagram describes the types of objects in the system and various kinds of static relationships which exist between them.
There are three principal kinds of relationships which are important to model:
- Association: Represent relationships between instances of types (a person works for a company, a company has a number of offices).
- Inheritance: The most obvious addition to ER diagrams for use in OO. It has an immediate correspondence to inheritance in OO design.
- Aggregation: Aggregation, a form of object composition in object-oriented design.
Mermaid also supports class diagrams.
classDiagram
    Animal <|-- Duck
    Animal <|-- Fish
    Animal <|-- Zebra
    Animal : +int age
    Animal : +String gender
    Animal: +isMammal()
    Animal: +mate()
    class Duck{
        +String beakColor
        +swim()
        +quack()
    }
    class Fish{
        -int sizeInFeet
        -canEat()
    }
    class Zebra{
        +bool is_wild
        +run()
    }
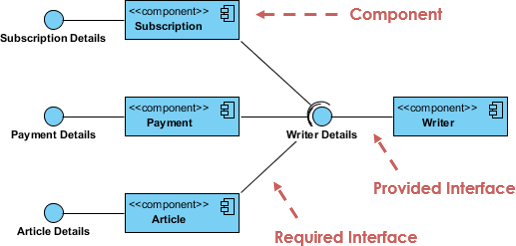
Component Diagram
A component diagram depicts how components are wired together to form larger components or software systems. It illustrates the architectures of the software components and the dependencies between them. Those software components include run-time components, executable components, also the source code components.
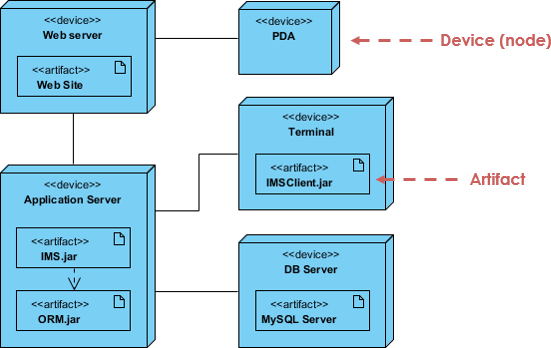
Deployment Diagram
The Deployment Diagram helps to model the physical aspect of an Object-Oriented software system. It is a structure diagram which shows the architecture of the system as deployment (distribution) of software artifacts to deployment targets. Artifacts represent concrete elements in the physical world that are the result of a development process. It models the run-time configuration in a static view and visualizes the distribution of artifacts in an application. In most cases, it involves modelling the hardware configurations together with the software components that lived on.
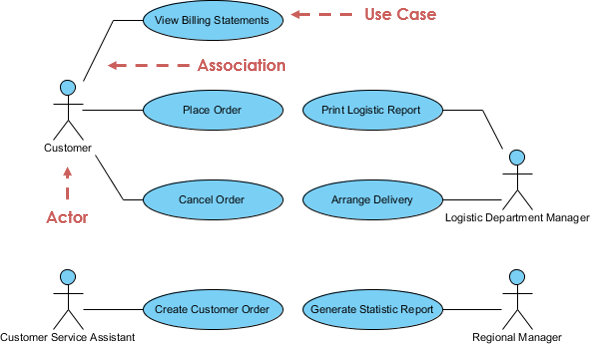
Use Case Diagram
A use-case model describes a system’s functional requirements in terms of use cases. It is a model of the system’s intended functionality (use cases) and its environment (actors). Use cases enable you to relate what you need from a system to how the system delivers on those needs. The use-case model is generally used in all phases of the development cycle by all team members and is extremely popular for that reason.
Keep in mind that UML was created before UX. Use Cases are very much like User Stories, but with more detail. Think of Use Cases == User Stories, and Actors == Personas (except that they can also model non-human actors like other systems).
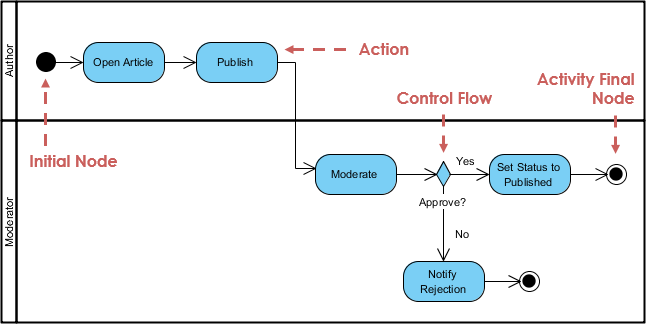
Activity Diagram
Activity diagrams are graphical representations of workflows of stepwise activities and actions with support for choice, iteration and concurrency. It describes the flow of control of the target system. Activity diagrams are intended to model both computational and organizational processes (i.e. workflows).
I use these a lot when designing interactive systems, and modelling transitions between screens or areas of functionality.
State Machine Diagram
A state diagram is a type of diagram used in UML to describe the behavior of systems. State diagrams depict the permitted states and transitions as well as the events that effect these transitions. It helps to visualize the entire lifecycle of objects.
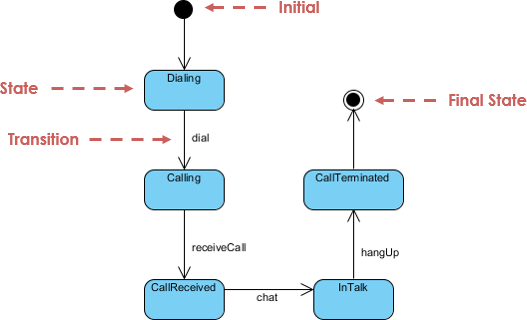
Mermaid also supports state diagrams.
stateDiagram-v2
    [*] --> Still
    Still --> [*]

    Still --> Moving
    Moving --> Still
    Moving --> Crash
    Crash --> [*]
stateDiagram-v2
    [*] --> Still
    Still --> [*]

    Still --> Moving
    Moving --> Still
    Moving --> Crash
    Crash --> [*]
Sequence Diagram
A Sequence Diagram models the collaboration of objects based on a time sequence. They show how objects interact over time and are great for showing ordering effects.
When do you use a Sequence Diagram over a more simple Activity Diagram? Use it when you have a more complex interaction between components. I’ve used these to model client-server authentication, for instance, or passing data between systems (where it might need to be encrypted/decrypted on each side).
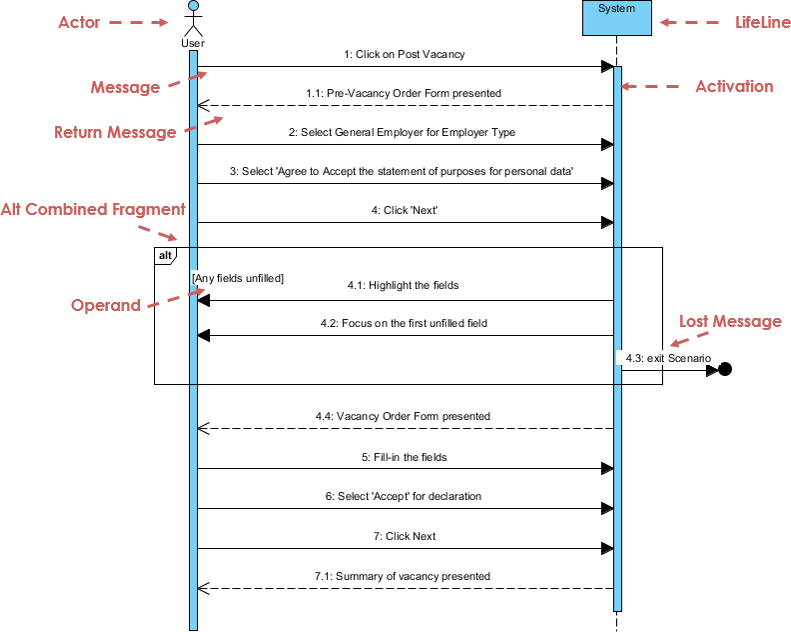
Mermaid does a great job of sequence diagrams as well.
sequenceDiagram
    Alice->>Bob: Hello Bob, how are you?
    Bob-->>Alice: Great!
    Alice-)Bob: See you later!
sequenceDiagram
    Alice->>Bob: Hello Bob, how are you?
    Bob-->>Alice: Great!
    Alice-)Bob: See you later!
There are various software packages on the market for creating UML diagrams.
- Figma: Figma Jam Boards have UML templates. They are very simple, but work for basic diagrams. Using Figma for this has the advantage of a single tool for all project diagrams.
- Mermaid.js: A library that can be used to draw inline diagrams in Markdown.
- Draw.io: A free web-based tool for drawing rich UML diagrams.